
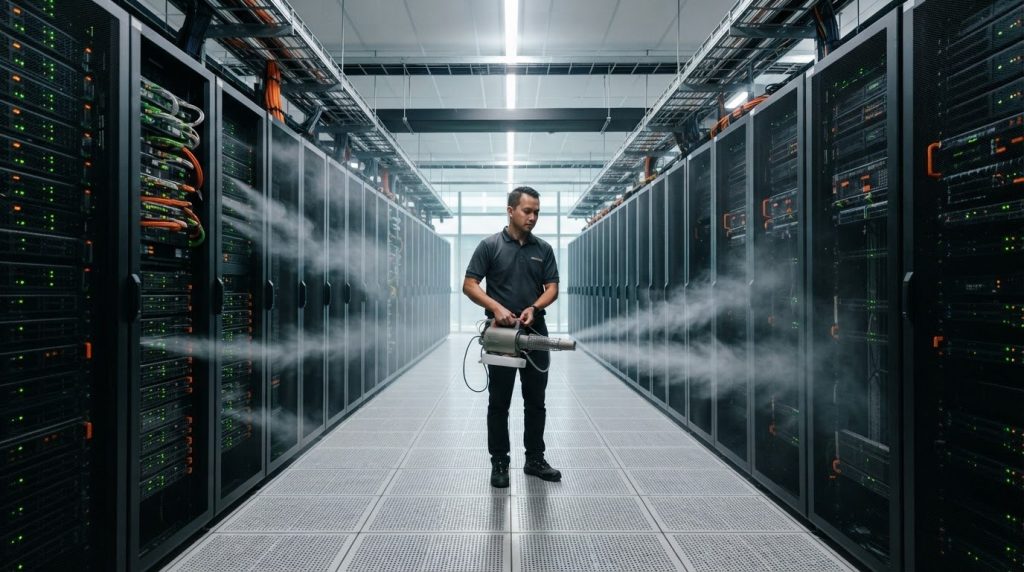
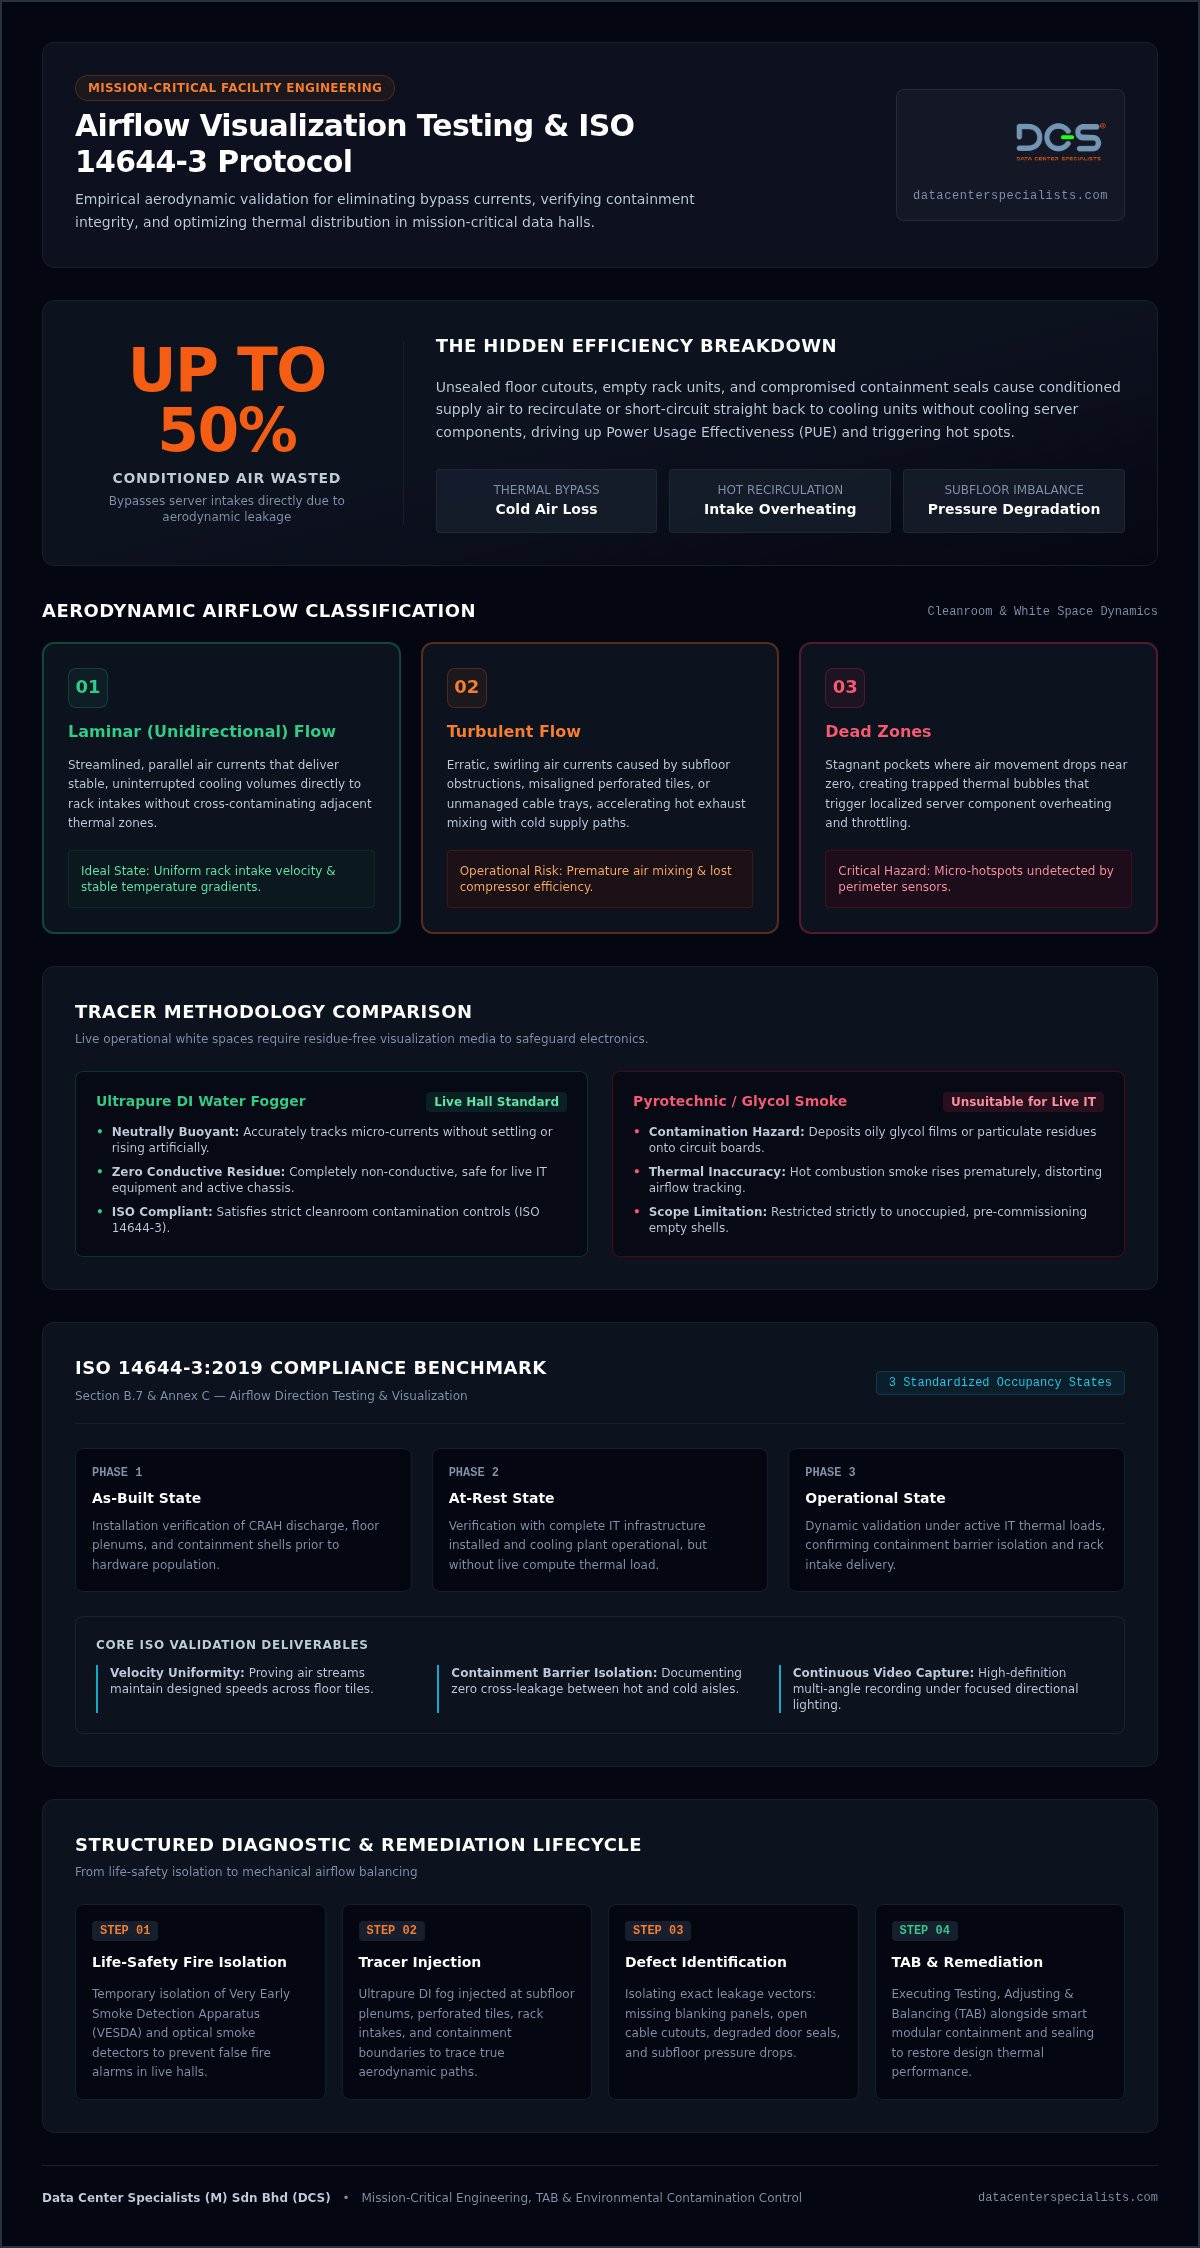
Up to 50% of conditioned air in mission-critical facilities never reaches server intakes, bypassing IT hardware entirely through unsealed floor cutouts, empty rack spaces, and compromised containment seals. Executing standardized airflow visualization testing bridges the gap between theoretical cooling designs and actual operational physics, providing the empirical proof needed to diagnose bypass currents and underfloor pressure imbalances.
You already know that increasing cooling plant capacity or dropping chiller setpoints won’t eliminate stubborn server hotspots when exhaust air actively recirculates back into cold aisles. It inflates your Power Usage Effectiveness (PUE), wastes valuable compressor power, and exposes high-density compute nodes to thermal throttling risks.
Mastering the methodology and standards of airflow visualization testing allows you to eliminate these hidden inefficiencies, prove containment integrity, and confirm compliance with ISO 14644-3 test procedures without risking operational downtime.
This guide walks you through neutral-buoyancy tracer techniques, life-safety fire isolation protocols for live rooms, and the diagnostic processes needed to generate actionable data for Testing, Adjusting, and Balancing (TAB).
Key Takeaways
- Understand how airflow visualization testing isolates the root causes of thermal bypass and hot air recirculation across server racks and underfloor plenums.
- Align your diagnostic procedures with ISO 14644-3 test methods to ensure controlled environment accuracy without generating conductive residues or particulate contamination.
- Follow a structured testing workflow using ultrapure deionized water foggers while managing essential safety controls like VESDA isolation in live operational halls.
- Differentiate between bypass airflow losses and hot air recirculation vectors to pinpoint exact leakage points across containment barriers and unsealed rack spaces.
- Translate visual test data into actionable mechanical remediation by integrating Testing, Adjusting & Balancing (TAB) with DCS Smart Modular Containment solutions.
What is Airflow Visualization Testing in Data Centers?
Airflow visualization testing is a qualitative engineering assessment that utilizes neutrally buoyant tracers to reveal air movement dynamics across mission-critical facilities. Rather than relying entirely on single-point sensor metrics or static temperature grids, facility engineers track how cooling supply currents physically travel through the white space. This empirical testing maps air distribution from Computer Room Air Handler (CRAH) discharge grilles, through raised-floor plenums, directly into IT equipment chassis.
To better understand how internal airflow dynamics interact with server racks and cooling infrastructure, watch this computational breakdown:
While generic smoke testing often relies on pyrotechnic canisters or chemical glycol sticks suitable only for empty construction shells, professional airflow visualization demands ultrapure, residue-free media safe for live electronic environments. In operational data halls, executing airflow visualization testing serves as an indispensable diagnostic protocol during both commissioning and routine lifecycle audits, ensuring cooling infrastructure actually performs to its engineering design parameters.
The Critical Role of Visualization in Thermal Management
Invisible aerodynamic inefficiencies undermine cooling effectiveness in high-density data halls. Physical visualization traces supply air trajectories, uncovering internal leakage paths where cold air returns straight to cooling units without cooling server components. Incorporating these diagnostic audits into your routine Data Center Maintenance schedule validates that mechanical air balancing matches live compute thermal loads across critical server rows.
Key Terminology: Laminar vs. Turbulent Flow
Cleanroom-grade cooling relies on predictable, low-velocity airflow patterns to maintain equipment reliability:
- Laminar (Unidirectional) Flow: Streamlined, parallel air currents that deliver stable, uninterrupted cooling volumes directly to rack intakes without cross-contaminating adjacent thermal zones.
- Turbulent Flow: Erratic, swirling air currents caused by subfloor obstructions, misaligned perforated tiles, or unmanaged cable trays, accelerating hot exhaust mixing with cold supply paths.
- Dead Zones: Stagnant pockets where air movement drops near zero, creating trapped thermal bubbles that trigger localized server component overheating.
Standards and Compliance: ISO 14644-3 Requirements
Engineering teams frequently cite cleanroom standards when designing mission-critical facilities, but operational execution often lags behind design intent. The international benchmark governing these assessments is ISO 14644-3:2019 (Cleanrooms and associated controlled environments, Part 3: Test methods). Specifically, Section B.7 and Annex C govern airflow direction testing and visualization. The standard outlines standardized procedures to verify that air distribution behaves predictably across three defined occupancy states: as-built, at-rest, and operational.
ISO 14644-3 defines test physics and measurement procedures rather than prescribing mechanical certifications or product guarantees. It provides the empirical framework to evaluate whether velocity distribution remains uniform and whether directional streams effectively isolate critical loads. In critical data processing halls, executing structured airflow visualization testing against these parameters provides definitive proof that containment barriers prevent air contamination between thermal zones.
ISO 14644-3 Test Procedures
Auditors require visual proof rather than speculative assertions. Meeting rigorous compliance criteria requires comprehensive video documentation alongside physical observation:
- High-Definition Video Capture: ISO-compliant reporting mandates continuous, multi-angle video recording under focused directional lighting to document tracer dispersal over time.
- Directional Constancy: Supply paths must exhibit steady travel toward rack intakes without erratic eddies pulling hot air back into chilled streams.
- Pressure Boundary Integrity: Testing must prove positive pressure differentials remain stable across containment partitions during active IT operations.
Review our comprehensive ISO 14644 Compliance Guide to understand how airborne cleanliness benchmarks align directly with thermal airflow standards.
Safety Standards for Tracer Particles
Generating visualization media inside active white spaces requires strict contamination controls. Conventional pyrotechnic smoke bombs, theatrical fog, and oil-based chemicals are prohibited in operational data centers. These media generate glycol residues or corrosive combustion byproducts that coat PCB traces, foul high-RPM server fan bearings, and degrade optical transceivers.
Professional assessments rely on neutrally buoyant aerosols generated via ultrapure Deionized (DI) water ultrasonic systems or Liquid Nitrogen (LN2) injection. These produce micro-droplets (typically 2 to 6 µm) that evaporate cleanly without leaving chemical residues or loading upstream HEPA filtration units. If your team plans to validate containment performance or baseline air distribution, consulting with Cleanroom Performance Testing specialists ensures your assessment methods strictly preserve hardware warranties and maintain uptime.
How to Conduct Airflow Visualization Testing: Step-by-Step
Executing airflow visualization testing inside live server halls requires precise operational discipline. Unlike static laboratory chambers, live computing environments feature dynamic variables like fluctuating fan curves, active thermal throttling, and pressurized containment zones that shift under IT workloads. A systematic engineering sequence ensures thorough data collection without disrupting operations:
- Define Baseline Parameters: Document current IT rack loads, baseline supply temperatures, and CRAH variable frequency drive (VFD) settings. Coordinate fire-safety protocols by temporarily isolating Very Early Smoke Detection Apparatus (VESDA) zones to prevent accidental clean-agent discharge.
- Deploy Clean Tracers: Position ultrasonic deionized (DI) water generators at target supply points to release neutrally buoyant aerosol plumes.
- Execute In-Situ Observation: Inject mist across raised floor tiles, server intake faces, and containment interfaces under peak and idle fan cycles.
- Capture Structured Video: Record the plume trajectories against dark contrast backdrops using directional LED arrays, filming perpendicular and parallel to the airflow.
- Map Remediation Priorities: Document thermal bypass vectors, air leaks, and recirculating eddies to create an actionable mechanical balancing roadmap.
Testing the Underfloor Plenum and Raised Floors
Subfloor dynamics directly determine tile delivery performance. Introducing tracer mist beneath the raised access floor exposes critical static pressure imbalances. High air velocity leaving downflow cooling units often induces a Venturi effect, siphoning warm room air downward through unsealed cable cutouts instead of delivering chilled air upward. Integrating specialized Cleanroom Performance Testing CPT protocols reveals unsealed perimeter gaps, unbrushed tile grommets, and congested cable pathways that starve high-density rows of required CFM volumes.
Validating Containment Integrity
Airflow visualization testing provides empirical validation for Hot Aisle Containment (HAC) and Cold Aisle Containment (CAC) structures:
- Containment Perimeter Seals: Releasing mist along sliding end-doors, ceiling baffles, and row-end partitions exposes pressurized cold air escaping into the surrounding hall.
- HAC Chimney Exhaust: Tracking exhaust plumes into overhead drops confirms hot discharge travels directly into the return plenum without spilling back toward intake faces.
- Internal Rack Leakage: Placing fog generators directly at equipment rack fronts immediately reveals open U-spaces and unsealed side rails, where cold supply air bypasses servers entirely.
Interpreting Results: Identifying Hotspots and Inefficiencies
Analyzing tracer dispersion transforms qualitative observations into diagnostic engineering criteria. Thermal inefficiencies in white spaces stem from two opposing fluid dynamics failures: recirculation and bypass airflow. Recirculation occurs when high-velocity server exhaust curls over the top of equipment racks, through empty vertical chassis gaps, or past row ends into the cold aisle. This immediately elevates server intake temperatures above ASHRAE TC 9.9 recommended thresholds (18.0°C to 27.0°C).
Conversely, bypass airflow occurs when conditioned supply air returns directly to CRAH units without passing through active IT hardware. Ultrasonic fog reveals this as chilled streams rushing across unpopulated floor areas or shooting straight into ceiling returns. In high-density blade and GPU environments drawing over 20 kW per rack, bypass air triggers rapid airflow entrainment. The intense suction of internal server fans pulls surrounding ambient air into the intake streams at odd angles. This induces shearing turbulence and starves top-mounted blades of uniform CFM delivery.
Common Airflow Pathologies in Data Centers
Airflow visualization testing quickly identifies distinct operational defects across active rows:
- Cooling Short-Cycling: Cold plumes discharging from perforated tiles get sucked immediately into nearby return grilles without entering IT faceplates, wasting mechanical fan energy.
- Unsealed Rack Rails: Open gaps between mounting rails and server chassis pull warm interior air into the intake stream, raising local server temperatures by several degrees.
- Missing Blanking Panels: Tracer mist demonstrates an immediate split in airflow behavior. Sealed rack units force air smoothly into chassis intakes, while open 1U or 2U slots generate circular eddies that draw hot exhaust straight backward into the rack face.
From Visualization to Actionable Data
High-resolution video records provide indisputable operational evidence for leadership teams, justifying capital expenditures for physical airflow containment retrofits or rack reconfiguration. Furthermore, these physical test recordings provide the ground-truth baseline needed to calibrate Computational Fluid Dynamics (CFD) models, ensuring digital twins match physical turbulence patterns around underfloor cable trays and pipe runs. Explore our CPT Buying Guide to evaluate testing specifications for critical environments.
To eliminate cooling inefficiencies and lower elevated PUE metrics, schedule a comprehensive Data Center Energy Assessment with our engineering specialists.
Optimizing the Environment Post-Visualization
Airflow visualization testing provides facility managers with the empirical evidence needed to stop guessing where conditioned cooling actually goes. Capturing video footage is only the diagnostic phase of the optimization cycle. Translating observed flow pathways into permanent operational improvements requires coupling visualization findings directly with quantitative mechanical adjustments and targeted infrastructure retrofits.
The Synergy of Visualization and TAB
Visual diagnostics show technicians precisely where supply air detours, but physical remediation demands measured mechanical calibration. Testing, Adjusting & Balancing (TAB) teams use tracer findings to reallocate underfloor CFM delivery, reposition high-flow floor grates, and adjust CRAH fan variable frequency drives (VFDs). Aligning physical test results with professional HVAC System Commissioning ensures every kilowatt of cooling capacity directly supports active IT equipment.
Eliminating hot exhaust recirculation lets operators safely raise chilled water setpoints. Increasing chilled water supply temperatures yields an efficiency improvement of 2% to 4% per degree Celsius. This provides immediate compressor power savings and assists regional facilities in meeting strict Malaysian and Southeast Asian PUE compliance benchmarks.
Leveraging Smart Infrastructure
Remediating aerodynamic faults requires purpose-engineered physical barriers. Deploying DCS Containment solutions, such as modular aisle end-doors and auto-closing ceiling panels, seals perimeter leakage points uncovered during testing. For high-density deployments exceeding 20 kW per cabinet, integrating DCS Smart Racks guarantees internal airflow segregation by preventing internal bypass along vertical mounting rails.
Facility teams can complete the optimization loop by following a structured post-visualization action plan:
- Rebalance Floor Tiles: Relocate high-flow perforated tiles away from CRAH discharge zones where static pressure dips, moving them directly in front of high-density compute clusters.
- Seal Residual Gaps: Install dense brush grommets on all underfloor cable penetrations and apply full-height blanking plates across unpopulated rack units.
- Schedule Periodic Verification: Conduct periodic airflow visualization testing every 12 to 24 months, or after major rack migrations, to validate that containment barriers remain uncompromised over time.
Transforming Airflow Diagnostics Into Measurable Efficiency
Maintaining thermal stability across high-density computing halls requires moving past static sensor arrays and unverified simulation assumptions. Standardized airflow visualization testing provides the definitive visual evidence your engineering team needs to pinpoint bypass leakage, seal containment breaches, and eliminate hot air recirculation before thermal throttling impacts compute performance.
Pairing non-destructive tracer diagnostics with systematic testing, adjusting, and balancing protocols lets you confidently optimize cooling distribution. You can reallocate underfloor air volumes, eliminate localized hotspots, and safely raise chilled-water supply temperatures without risking SLA breaches. These empirical workflows protect high-density server hardware while systematically lowering facility PUE.
Validating containment integrity in operational data halls demands specialized precision. Backed by ISO 14644-3 compliant methodologies and extensive field experience in live mission-critical spaces, our specialized TAB and CPT engineering team helps you resolve aerodynamic faults without risking facility downtime. Contact Data Center Specialists for a professional airflow visualization assessment to secure peak thermal efficiency across your critical infrastructure.
Frequently Asked Questions
What is the difference between smoke testing and airflow visualization?
Traditional smoke testing typically uses crude chemical or pyrotechnic smoke canisters simply to check general leakage paths in non-critical construction settings. In contrast, professional airflow visualization testing uses high-purity, neutrally buoyant aerosols under controlled optical lighting. This specialized methodology maps micro-airflow dynamics, turbulence, and pressure boundaries across live server halls without leaving chemical residues or triggering unmanaged particulate contamination.
Is the smoke used in airflow visualization safe for live IT equipment?
Yes, provided the testing team uses high-purity deionized (DI) water or liquid nitrogen fog rather than theatrical chemical mixtures. Glycol and oil-based smokes leave persistent, conductive films that corrode electronics and foul fan bearings. Ultrasonic DI water fog produces microscopic droplets that evaporate completely into the air stream, leaving zero conductive residue on circuit boards, optics, or sensitive server intake filters.
How often should airflow visualization testing be performed in a data center?
Facility operators should conduct testing during initial commissioning and subsequently every 12 to 24 months as part of preventive facility maintenance. Re-testing is also strongly recommended whenever you execute major rack reconfigurations, install high-density compute clusters exceeding 15 kW per rack, or replace cooling plant hardware. Routine testing ensures structural shifts or cable congestion haven’t compromised your containment integrity.
Can airflow visualization help lower my Data Center PUE?
Yes, empirical visualization reveals bypass airflow and recirculation paths that waste chilled air. Pinpointing these leakage vectors allows engineering teams to seal containment barriers, rebalance floor tiles, and eliminate server hotspots. Once recirculation ceases, facility managers can safely increase CRAH supply air temperatures and chilled-water setpoints. Raising supply water temperatures reduces chiller compressor workloads, directly lowering total mechanical power draw and driving down PUE.
What ISO standard covers airflow visualization testing?
ISO 14644-3:2019 covers airflow visualization testing under Section B.7 and Annex C for controlled environments. The standard outlines specific procedures for evaluating airflow direction and velocity uniformity across as-built, at-rest, and operational facility states. It establishes testing physics, apparatus requirements, and documentation practices, ensuring data center audits generate verifiable, audit-grade visual proof without relying on subjective guesswork.
What equipment is used to generate the tracer fog for these tests?
Engineers utilize ultrasonic deionized (DI) water fog generators or liquid nitrogen (LN2) injection systems paired with high-purity water. These systems use piezoelectric transducers to produce high-density, neutrally buoyant aerosol droplets ranging between 2 and 6 micrometers. Testing rigs also include directional high-lumen LED lighting arrays, black non-reflective backdrop screens, and high-definition cameras to capture clean contrast videos of air movement.
Do I need to shut down my servers during the airflow visualization test?
No, testing should occur while IT hardware remains fully powered and operating under representative thermal loads. Evaluating airflow in a live environment captures realistic server fan curves, heat exhaust turbulence, and active differential pressures. Before releasing neutral-buoyancy fog, engineers coordinate with site operations to isolate aspirated smoke detection systems like VESDA, preventing false alarms while servers stay online.
How long does a typical airflow visualization study take to complete?
On-site testing for a standard data hall row or containment pod typically takes between four and eight hours. The complete engagement, including pre-test safety briefings, VESDA bypass protocols, multi-point video capture, post-test normalization, and engineering analysis, usually spans one to three days. Large enterprise or hyperscale halls with complex underfloor plenums may require phased scheduling across several shifts.